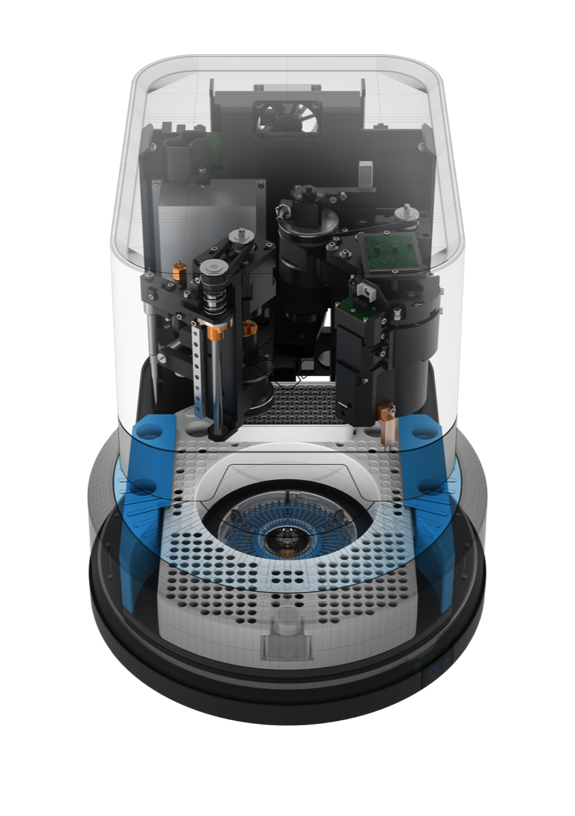
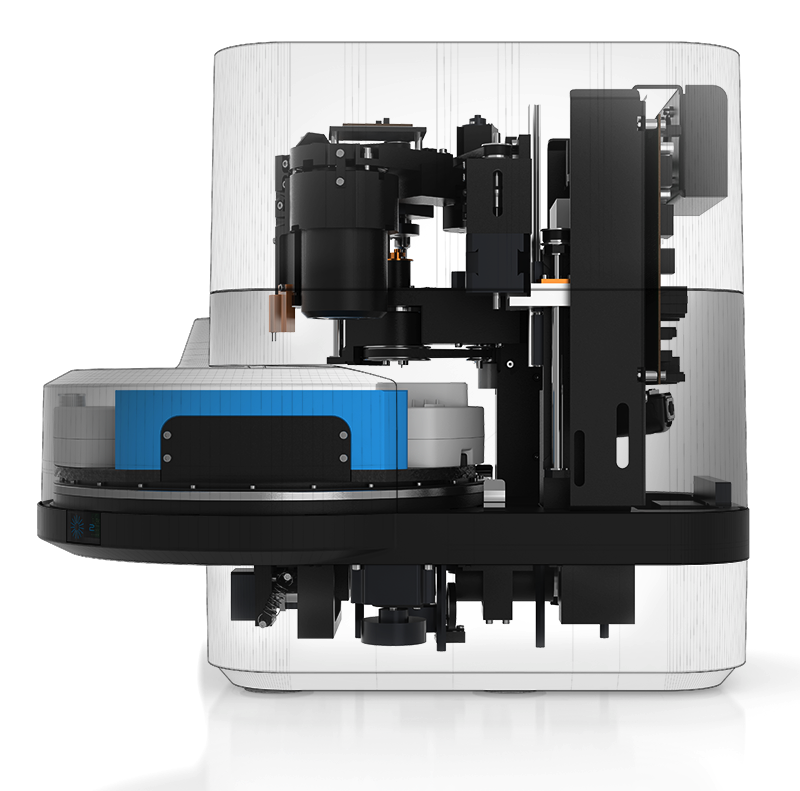
While at Accelerate Diagnostics, I spent most of my time working on Clonetracker, an image processing library for the Pheno. The Pheno is essentially an automated microscope with a camera instead of the traditional ocular and a mechanized pipettor. The microscope has the ability to perform imaging in dark-field (to enhance contrast of unstained bacteria) and three colors of fluorescence. The pipettor potentially allows a wide variety of assays to be run, although the company strongly focused on antimicrobial susceptibility testing from a positive blood culture.
While all the details are proprietary, this post provides a quick overview of the methods and a description of the type of image processing that is involved.

Sample Preparation
A positive blood culture is essentially opaque, so the first task is to clean up the sample for microscopic imaging.
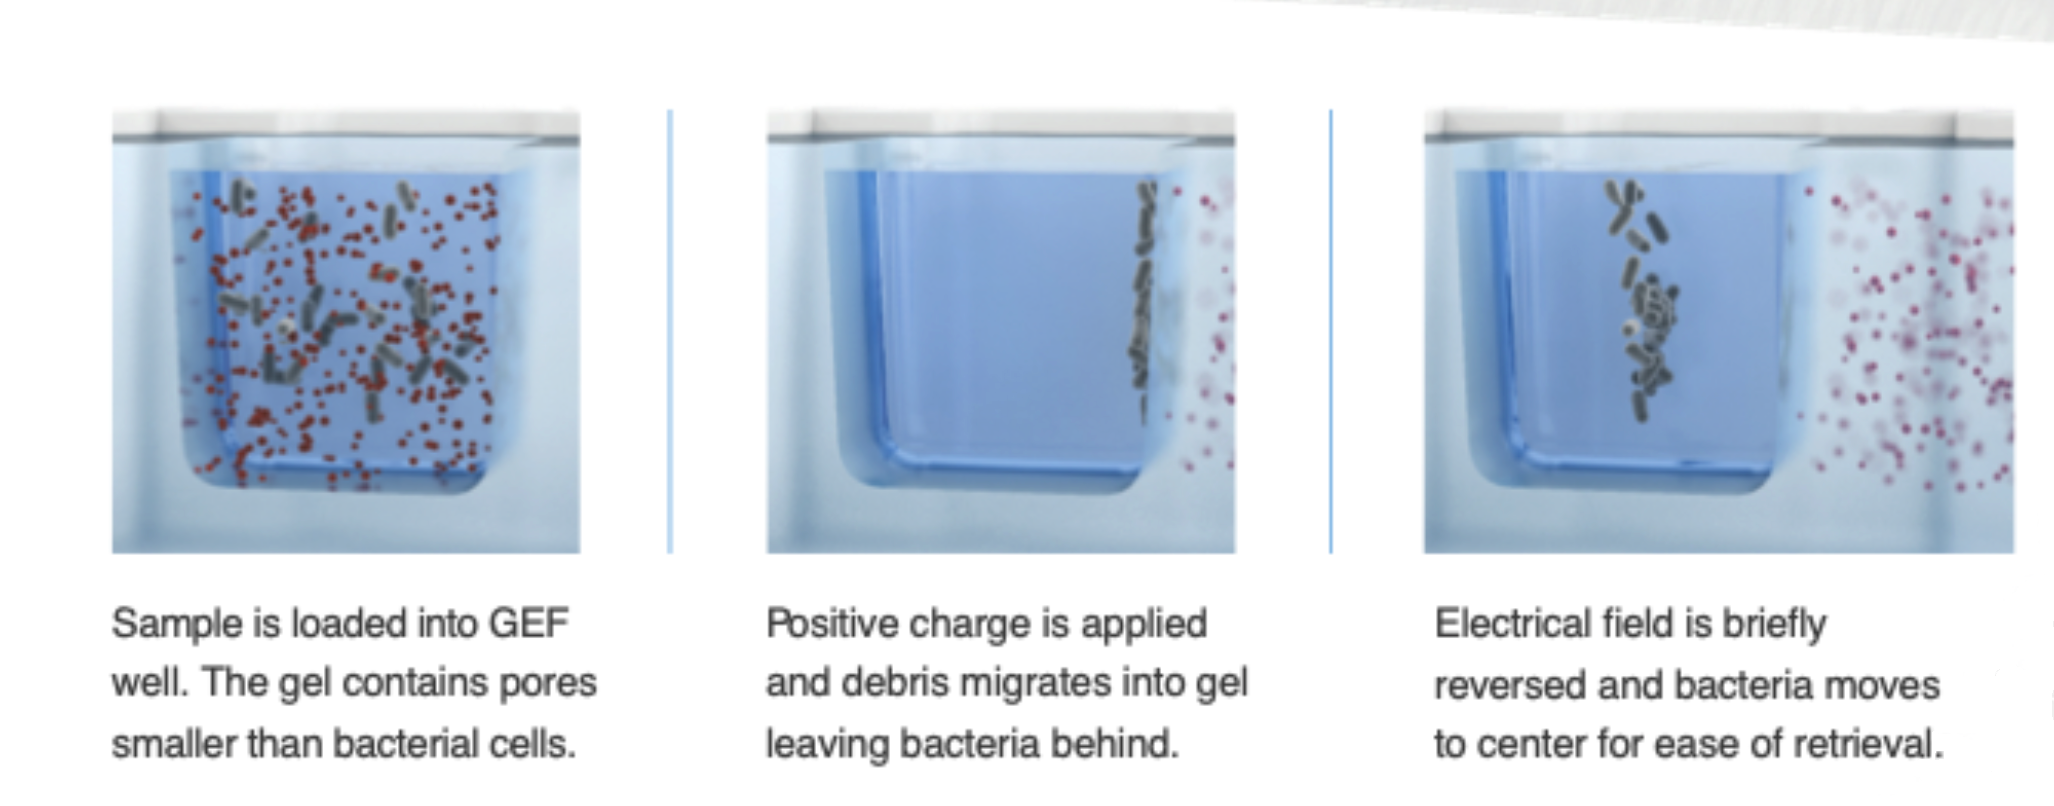
Cleanup is performed using gel electro-filtration (GEF) which is a combination of size-exclusion and gel electrophoresis. The sample is transferred to a well made from gel that contains pores smaller than bacterial or yeast cells. Application of an electric field causes lysed blood cells and/or other small sample debris to pass into the gel while bacterial/yeast cells remain inside the gel well. The electric field is briefly reversed to dislodge bacterial/yeast cells from the gel wall prior to removal.
After cleanup, the next task is to get the bacteria to the surface of the consumable. This helps to address the challenge of focusing and limits the amount of scanning needed to track the bacteria as they grow.
Conductive layers of transparent indium tin oxide coat the top and bottom inner surfaces of each flowcell in the consumable and act as electrodes. An additional cationic poly-L-lysine layer on the bottom of each flowcell acts as a capture surface. When a voltage is applied, the negatively-charged bacterial/yeast cells migrate to the positively-charged capture surface where they are immobilized prior to imaging.
ID Method - Fluorescence In Situ Hybridization (FISH)
For identification, the bacteria are permeabalized with enzymes. Then, cocktails of ATTO-532 (green) fluorescently-labeled DNA probes bind to the ribosomal RNA of target organisms. All cells are counter-stained with ATTO-647 (red) labeled universal bacterial probe that binds to the ribosomal RNA of all clinically relevant bacteria. This combination of stains results in the ability to discriminate debris (dark-field only) from bacteria (dark-field and red), and the target organism (signal in all channels).
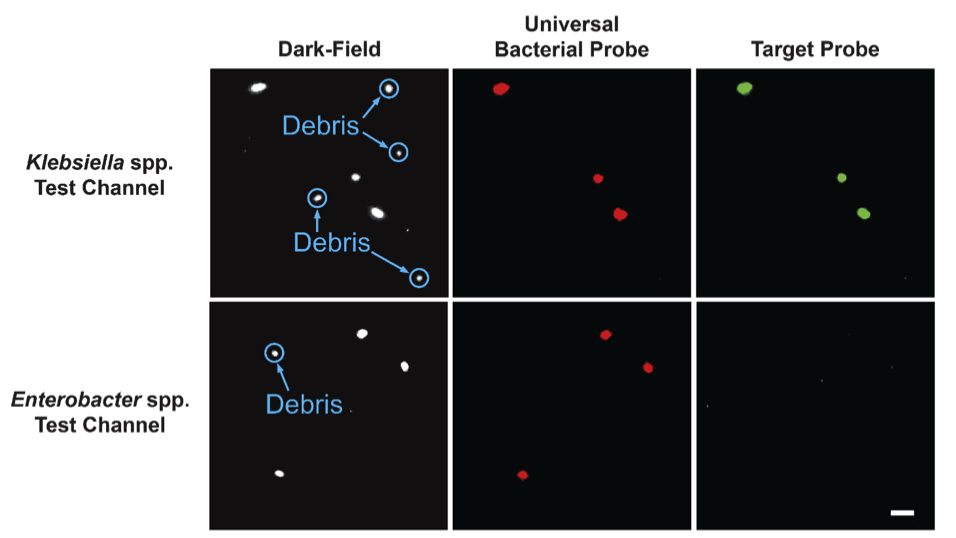
Representative images of a K. oxytoca sample in two different test channels with probes targeting Klebsiella spp. and Enterobacter spp. Images zoomed in to view individual cells. Scale bar in lower right image is 10 μm.
ID Image Processing
While the sample above shows “publication ready” images, the image processing library first needed to determine focus, detect objects, filter debris, and then make the identification call using information from the different target channels. After a variety of image quality checks, a wavelet-based spot detection method identified candidate cells. The pipeline then fits an ellipse to each spot and filters objects that couldn’t be cells. After colocalization across colors, each object could be classified as debris, bacteria, or target bacteria for that channel.
At a high level, this is very similar to how flow cytometry gating with fluorescence works. After processing, there is a 2D density plot showing the cells in each channel:
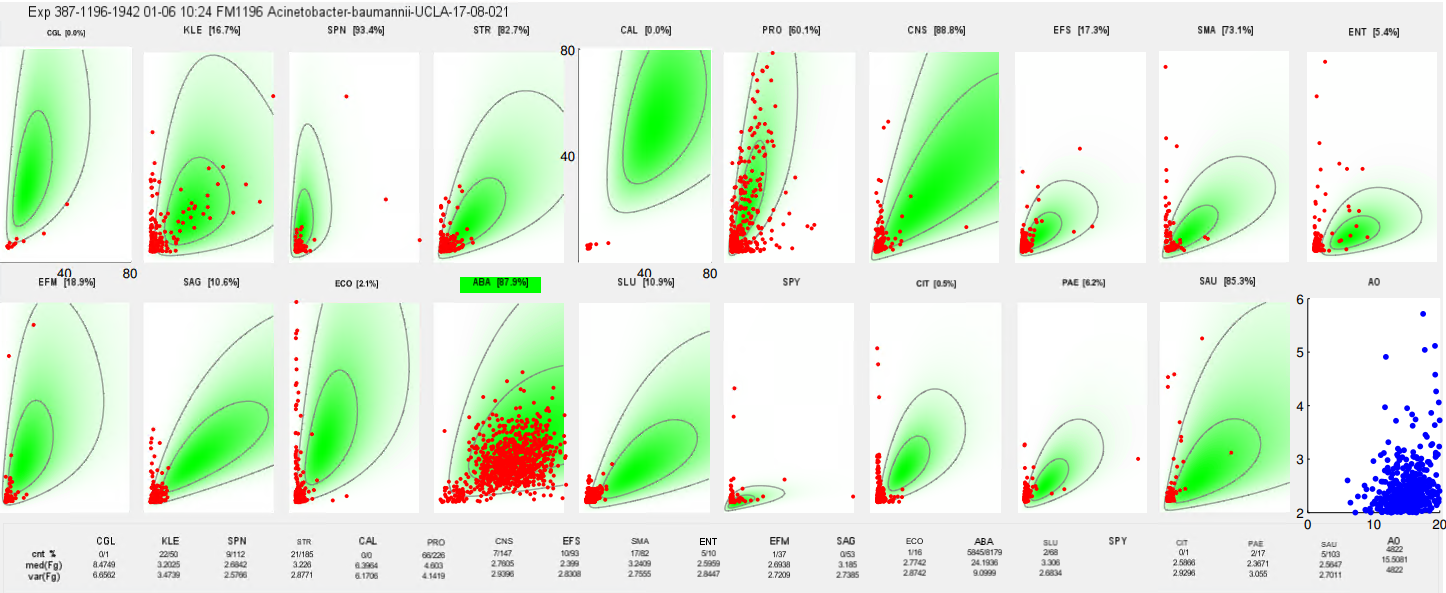
In this example, we can see the expectation for staining in each flowcell (2D density shaded green with contours) along with each detection (red dot). Identification calls are made based on detecting a sufficient number of well-stained cells in the target channel.
AST Method - Dark-Field Time-Lapse Microscopy
After the bacteria in the sample is identified, the Pheno picks a panel of the relevant antimicrobials and proceeds to susceptibility testing (AST). A portion of the sample that still contains live bacteria is combined with growth media. Then, the pipettor prepares each flowcell by mixing bacteria, melted agarose gel, the antimicrobial for that channel, and loading twenty microliters. The bacteria in each flowcell are imaged every ten minutes for four hours, creating a time-lapse record of bacterial growth from individual progenitor cells into clones of daughter cells as shown below.

If there is an antibiotic present and the bacteria are susceptible, they may grow slower, lyse, or show a stress response like filamentation. Example of filamentation:

Another example, shown as static images highlighting the difference between very clear resistance and susceptibility:
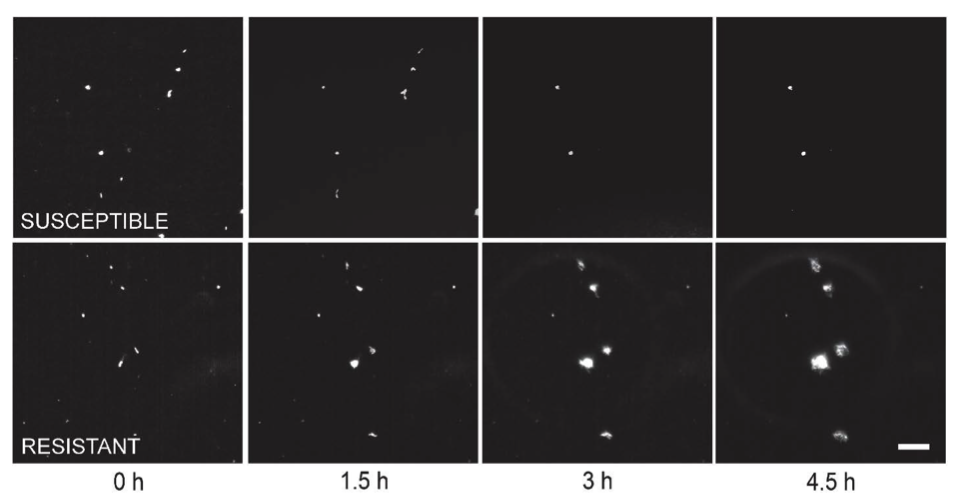
Susceptible clones arrest or lyse while resistant clones continue to grow. Images zoomed in to view individual bacterial clones. Scale bar in the lower right image is 20 μm.
AST Image Processing
During the imaging period, microscopic features of the bacteria are measured by Clonetracker including cell morphology and the intensity of growing clones over time. Similar to the ID processing pipeline, the AST pipeline performs the same steps (focusing, registration, spot detection, model/ellipse fitting) although now colocalization is replaced by tracking clones over time. At the end of imaging, each channel has a distribution for each feature. Here is an example showing the population of the “raw” intensity over time in one channel:
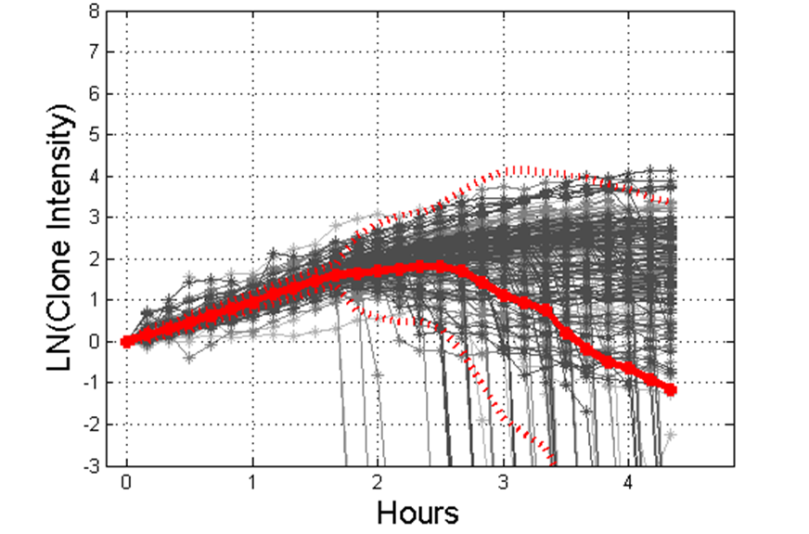
And here is an example of how that intensity varies based on how susceptible or resistant the bacteria are to an antimicrobial:
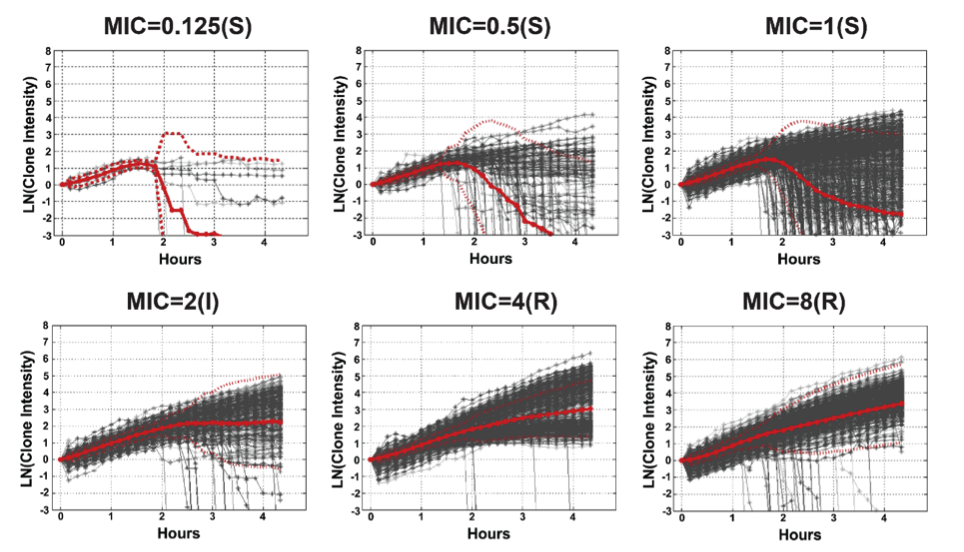
Bacterial cell susceptibility pattern profiles for susceptible (S), intermediate (I) and resistant (R) P. aeruginosa isolates growing in ciprofloxacin with MICs ranging from 0.125 μg/mL to 8 μg/mL. Each grey line is the growth curve for an individual bacterial clone. Solid red lines are the average and dotted red lines are two standard deviations from the average.
Clonetracker uses summary statistics on the population as features to classify1 each bacterial strain at the minimum inhibitory concentration level for each antimicrobial tested.
-
Arguably this should be framed as regression since the MIC is a concentration and theoretically continuous. However, AST in the clinical lab is idiosyncratic and practically limited to a small reportable range of doubling dilutions. ↩